Zabbix Email Notifications

Overview

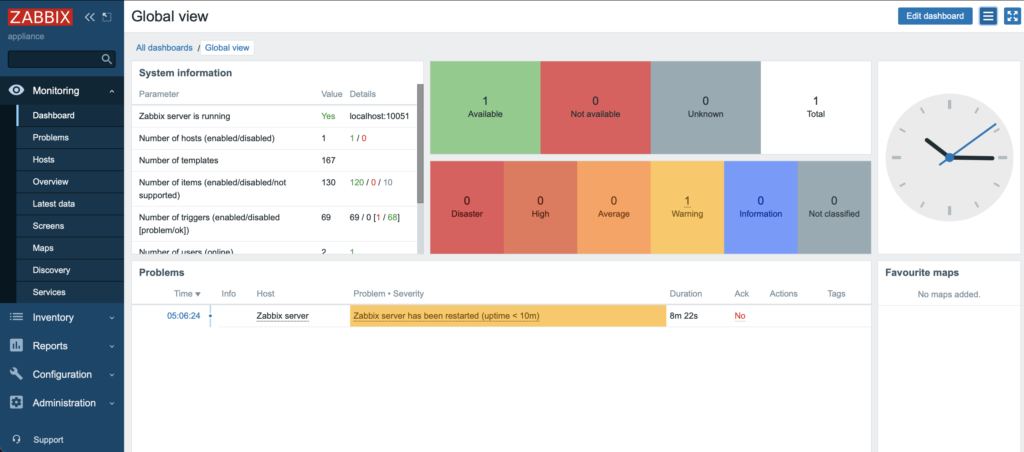
Now that we’ve setup a Zabbix server and configured some hosts, we need to get notified when there are issues with our hosts. The easiest way to be notified is probably via email (This is my go-to notification option since it is so widely supported).

Email Configuration

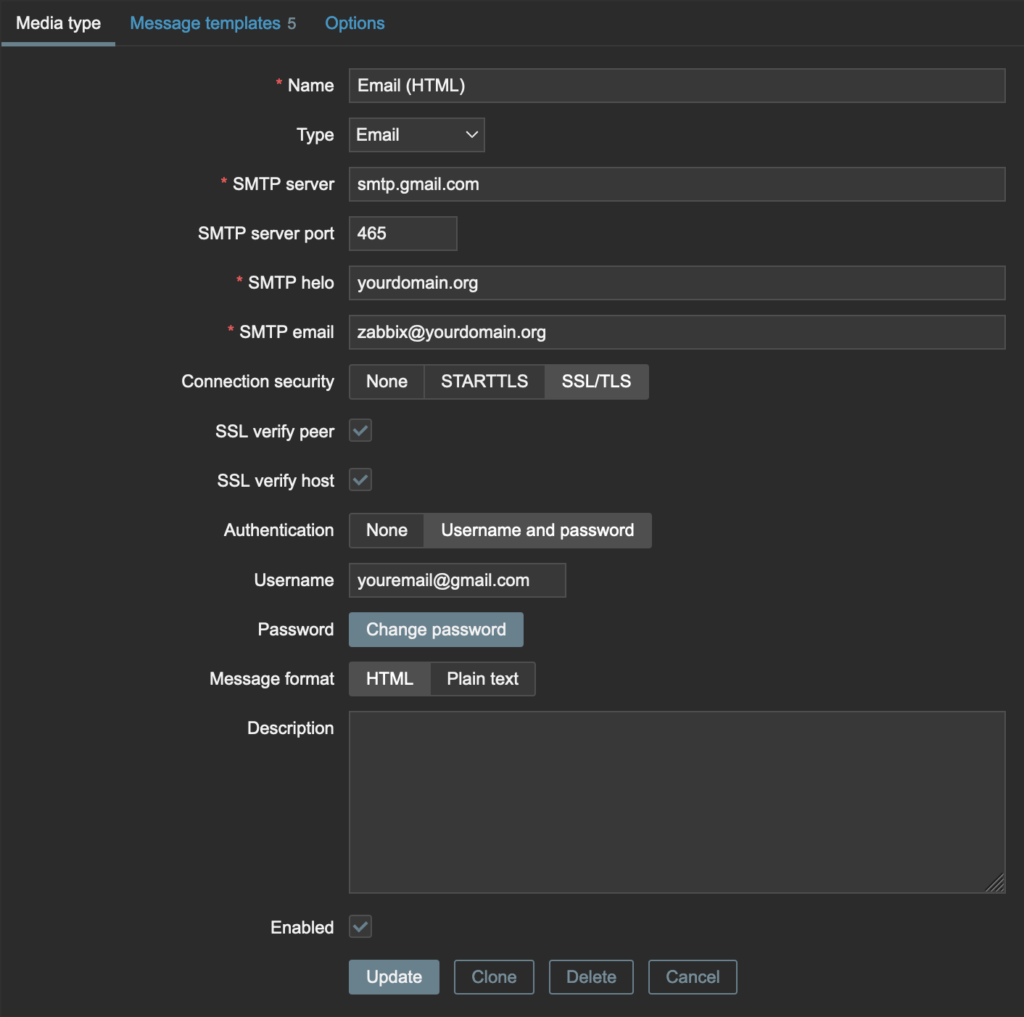
Configuring the email service is pretty straightforward:

  1. In the Zabbix WebUI navigate to: Administration > Media Types > Email (HTML)
  2. Update the outgoing SMTP settings to match those of your email provider (i.e. Gmail)
    • Be sure to setup and use an App Password if you have two-factor enabled for your email account.
  3. Click Update
  4. Click Test to make sure the settings work.

Enable Email Notifications for User

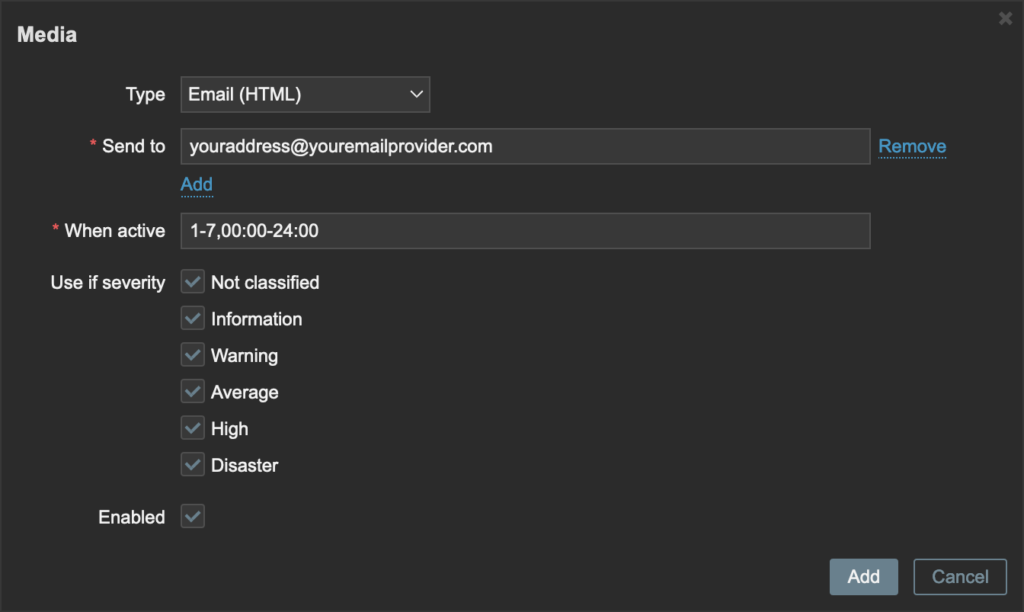
In order for emails to be sent, you need to enable them for your Zabbix user:

  1. In the Zabbix WebUI navigate to: User Settings > Media > Add
  2. In the Type box choose ‘Email (HTML)
  3. Add the email address to which you would like to send notifications.
  4. Click Add
  5. Click Update

Choose Which Notifications to Receive

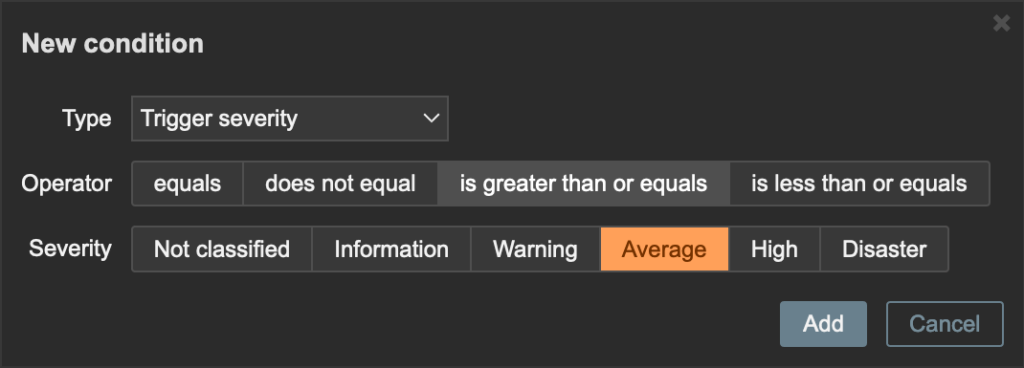
Now that we have the email service configured and the user set to receive emails, we need to tell Zabbix which types of emails to send (what severity, which hosts, or which triggers). In general I like to be notified of any triggers that have a severity of Average or above:

  1. In the Zabbix WebUI navigate to: Configuration > Actions > Report problems to Zabbix administrators
  2. Under Conditions click Add
  3. Choose Type:Trigger severity and choose what severity you would like to be notified for (I choose ‘is greater than or equals’ a severity of ‘Average
  4. Click Add
  5. Check the Enabled box.
  6. Click Update

Enjoy!

Now sit back and wait for the notifications to roll in – or instead of waiting, go make some breaking changes to your Hosts! (Just make sure you can roll back your changes easily with something like Proxmox backups/snapshots!)

Zabbix Host Configuration

Overview

If you’re not sure what Zabbix is or how to set it up, see my first Zabbix blog post. Once we have a running instance of the Zabbix server we can begin adding hosts that we would like to monitor. Adding a host consists of two primary steps: Configure the Client & Configure the Host (Server).

Configuring a Host

In order for Zabbix to get information from a client machine (Zabbix calls them Hosts) we need to configure some kind of protocol for Zabbix to use when fetching information. Some of the most popular protocols Zabbix uses are:

  • Zabbix Agent <- I Prefer this
  • SNMP <- Often built in – so requires no additional software
  • JMX <- For monitoring Java applications(?)
  • IPMI <- Good for enterprise gear (HP iLO, DELL DRAC, IBM RSA, Sun SSP, etc)

Below are a few host configurations for some of the above ‘protocols’.

Host Configuration: Zabbix Agent

In order to use the Zabbix agent, we can simply install the agent like any other package:

# Install the agent on Ubuntu/Debian
apt-get install zabbix-agent

# Configure agent with Zabbix server address
nano /etc/zabbix/zabbix_agentd.conf
# Update `Server=` to the ip/hostname of your Zabbix server

# Start the Zabbix Agent
service zabbix-agent start

Host Configuration: SNMP

Configuring the host with SNMP will be different for each machine, but usually there is some kind of simple GUI that allows you to enable SNMP, and provide a community string (a sort of authentication). Here’s an example that used the term ‘Trap’ to represent the SNMP configuration:

Host Configuration: IPMI

The IPMI configuration also may be different for each machine, but it is generally pretty easy to enable:

Configuring a Host on the Server (Zabbix)

Once we have the hosts configured with at least once source ‘protocol’ we can add them to Zabbix. This is also pretty straightforward:

  • In the Zabbix WebUI navigate to: Configuration > Hosts > Add Host and provide a hostname, a group and interface(s). Once finished, click Add. Note: you can also use a hostname in the DNS name field instead of an ip address.
    • Note: If configuring IPMI, you’ll need to provide the host credentials on the IPMI tab.
  • Also, be sure to add at least one Template to the host. Templates help Zabbix categorize the data it fetches from the hosts – templates can be used on many machines to standardize the data that is fetched from the hosts.
    • You can search for existing templates in the Link new templates field and add any relevant templates you think may be useful.
    • When searching for templates I usually search for the protocol (Agent/SNMP/IPMI/etc)

Monitor your Hosts

Now that we have some hosts added we can monitor them and view any problems or issues that may need to be addressed:

By clicking on the links we can view the Latest Data any Problems or even some nice Graphs for each Host:

There are some pretty slick options for getting notifications when problems happen, reporting, network maps, and more, but we’ll have to save those goodies for a future blog post. For now, get to work adding your hosts!

~ Thought of the Day: Why is it normal in the US for a waiter to take your credit card out of your sight when processing payments? To me this is like having your email password in plain text of the footer of your email!

Installing Zabbix for HomeLab Monitoring

Overview

With a quickly growing HomeLab that contains many servers/services/devices I am starting to see the importance of being able to monitor all these ‘things’ from a central location. My understanding is that the goal of Zabbix is to do exactly this. So lets give it a go!

Installation

Initially i figured I would just install Zabbix in Docker like I do for most other services, but i quickly realized that the docker-compose would get messy pretty quick (see here for a sample). After looking over the install options on the Zabbix site, i realized that they offer a virtual appliance that can be run on most hypervisors (I run proxmox which supports the qcow2 KVM disk format). Here’s my steps for installing the virtual appliance in Proxmox (additional installation details can be found on the Zabbix appliance documentation):

Create a Proxmox Virtual Machine

When creating the VM, you can use all the default options, just give it a name and remove the HardDisk after the VM is created (we will add the Zabbix appliance disk later).

VM Created in Proxmox (Shows Zabbix disk added)

Download the Appliance

# From the proxmox shell run the following to download the appliance
# Note: Right click the Zabbix appliance download link to get the latest version
wget https://cdn.zabbix.com/zabbix/appliances/stable/5.2/5.2.5/zabbix_appliance-5.2.5-qcow2.tar.gz

Unzip the Appliance

tar -xvzf zabbix_appliance-5.2.5-qcow2.tar.gz

Import the Appliance Disk to the Virtual Machine

# Note: Change the vm id, the appliance version and the storage type below
#       (you may need to use 'local' if you are not using 'zfs')
qm importdisk 105 zabbix_appliance-5.2.5.qcow2 zfs

# Cleanup unneeded files
rm -rf zabbix_appliance-5.2.5-qcow2
rm zabbix_appliance-5.2.5-qcow2.tar.gz

Update VM Options

At this point you’ll want to make sure your VM is set to boot from the imported disk and to start on boot.

Set VM to boot from imported disk

Assign Static IP Address (Optional)

Note: At this point it may be helpful to assign a DHCP Static mapping so your VM will receive a static IP address from your Router. This is how I did it in OPNSense:

Start VM

Now that we’ve got the VM setup, go ahead and start it up! The default login credentials were:
User: root
Pass: zabbix
Note: The default front-end web interface default login is shown in the console below:
User: Admin
Pass: zabbix

Proxmox Console View

Log Into the Web Interface

In your browser navigate to the IP address of your Zabbix VM:

Zabbix Web Login
Zabbix Dashboard

Congratulations. You have have a running Zabbix Instance! Don’t forget to finish configuring and securing your instance. A few items I addressed immediately were:

  • Changing Web login credentials: WebUI > User Settings > Change Password
  • Changing Console credentials: `sudo passwd root`
  • Change timezone: `cp /usr/share/zoneinfo/US/Eastern /etc/localtime`
  • For fun: change to the dark theme: WebUI > User Settings > Theme

Get Monitoring!

Now that you’re setup, what are you waiting for, get started monitoring all the things! We won’t cover how to setup monitoring in this post, we’ll save that for a future post which delves deeper into the benefits and use-cases of Zabbix. Enjoy! Also see Zabbix Host Configuration and Zabbix Email Notifications.